The Critical Role of Validation in Cluster Analysis
Executing a clustering algorithm is merely the first step; the true measure of success lies in validating its results. In data science and marketing, the purpose of measuring cluster success extends beyond statistical fit—it’s about extracting actionable insights that drive tangible business value, such as segmenting customers for targeted campaigns.
Clustering, as an unsupervised learning technique, operates without pre-defined labels or "ground truth." This inherent lack of a clear target creates a significant challenge: objectively determining if generated clusters are meaningful, stable, and useful for decision-making. Practical experience shows that without rigorous validation beyond initial execution, clusters can be arbitrary, leading to misinformed strategies.
Key validation challenges include:
- Assessing cluster stability across different datasets.
- Interpreting business relevance and actionable potential.
For a comprehensive overview, see measuring cluster success.
Laying the Groundwork: Data Preprocessing and Algorithm Selection
Effective cluster analysis begins long before algorithm execution, rooted in meticulous data preprocessing and informed algorithm selection. Field observations consistently show that these foundational steps critically impact the validity and utility of the resulting clusters.
Normalization and standardization are paramount. Scaling features to a consistent range (normalization) or transforming them to have a zero mean and unit variance (standardization) prevents features with larger numerical magnitudes from dominating distance calculations. For instance, in customer segmentation, standardizing purchase value alongside browsing duration ensures both contribute proportionally to cluster cohesion, preventing segments from being solely defined by high-spending outliers.
Further refining the dataset involves feature selection and dimensionality reduction. High-dimensional data can introduce noise and computational burden, a phenomenon known as the "curse of dimensionality." Techniques like Principal Component Analysis (PCA) transform features into a lower-dimensional space, preserving most of the variance while improving algorithmic efficiency and interpretability. Practical experience indicates this often reveals underlying structures more clearly.
Finally, selecting the appropriate clustering algorithm is dictated by the inherent data shape and business goals:
- K-Means is efficient for spherical, dense, and well-separated clusters.
- DBSCAN excels at identifying arbitrary cluster shapes and isolating noise, making it ideal for identifying irregularly shaped customer groups.
- Hierarchical Clustering provides a nested sequence of clusters, which is useful when the optimal number of clusters is unknown a priori, allowing for the exploration of various granularity levels.
Quantitative Frameworks for Measuring Cluster Success
After meticulously preparing data and selecting an appropriate algorithm, the next critical phase in cluster analysis involves quantifying the success of the generated clusters. This requires a robust set of metrics that can objectively evaluate cluster quality, whether or not ground truth labels are available. Field observations indicate that a multi-faceted approach—combining internal and external validation alongside interpretative analysis—yields the most reliable insights.
Internal Validation Metrics: Assessing Intrinsic Structure
Internal metrics evaluate the quality of a clustering based solely on the data and the resulting partitions, without requiring external information. They measure how well data points are grouped within clusters and how distinct those clusters are from one another.
- Silhouette Score: This metric quantifies how similar an object is to its own cluster compared to other clusters. Ranging from -1 to +1, a high positive score (closer to +1) indicates that objects are well-matched to their own cluster and poorly matched to neighboring clusters, suggesting a good, dense clustering with clear separation. Conversely, scores near 0 imply overlapping clusters, while negative scores suggest data points might be assigned to the wrong cluster.
- Davies-Bouldin Index: This index measures the ratio of within-cluster scatter to between-cluster separation. A lower Davies-Bouldin score indicates better clustering, meaning clusters are compact and well-separated. It is particularly useful for identifying situations where clusters are either too spread out or too close together.
- Calinski-Harabasz Index (Variance Ratio Criterion): This metric calculates the ratio of between-cluster variance to within-cluster variance. Higher values of the Calinski-Harabasz Index generally indicate better clustering, signifying that clusters are distinct and internally cohesive. It is computationally efficient and often provides a strong indication of distinct cluster structures.
External Validation Metrics: Leveraging Ground Truth
When ground truth labels are available—perhaps from prior expert classification or a different, established segmentation—external metrics become invaluable. They compare the clustering results directly against these known labels, providing a measure of accuracy and agreement.
- Adjusted Rand Index (ARI): The ARI measures the similarity between two clusterings (your generated clusters and the ground truth labels), adjusting for chance. It ranges from -1 to +1, where +1 signifies a perfect match, 0 indicates random labeling, and negative values suggest disagreement worse than random. It is a robust metric that accounts for all pairs of samples and their relationships.
- Normalized Mutual Information (NMI): NMI quantifies the mutual dependence between the two clusterings, normalized to fall between 0 and 1. A value of 1 indicates perfect correlation (the clusterings are identical), while 0 signifies complete independence. NMI is effective at handling varying cluster sizes and numbers, providing a balanced assessment of information shared between the two partitions.
Interpreting Cluster Centroids and Density for Significance
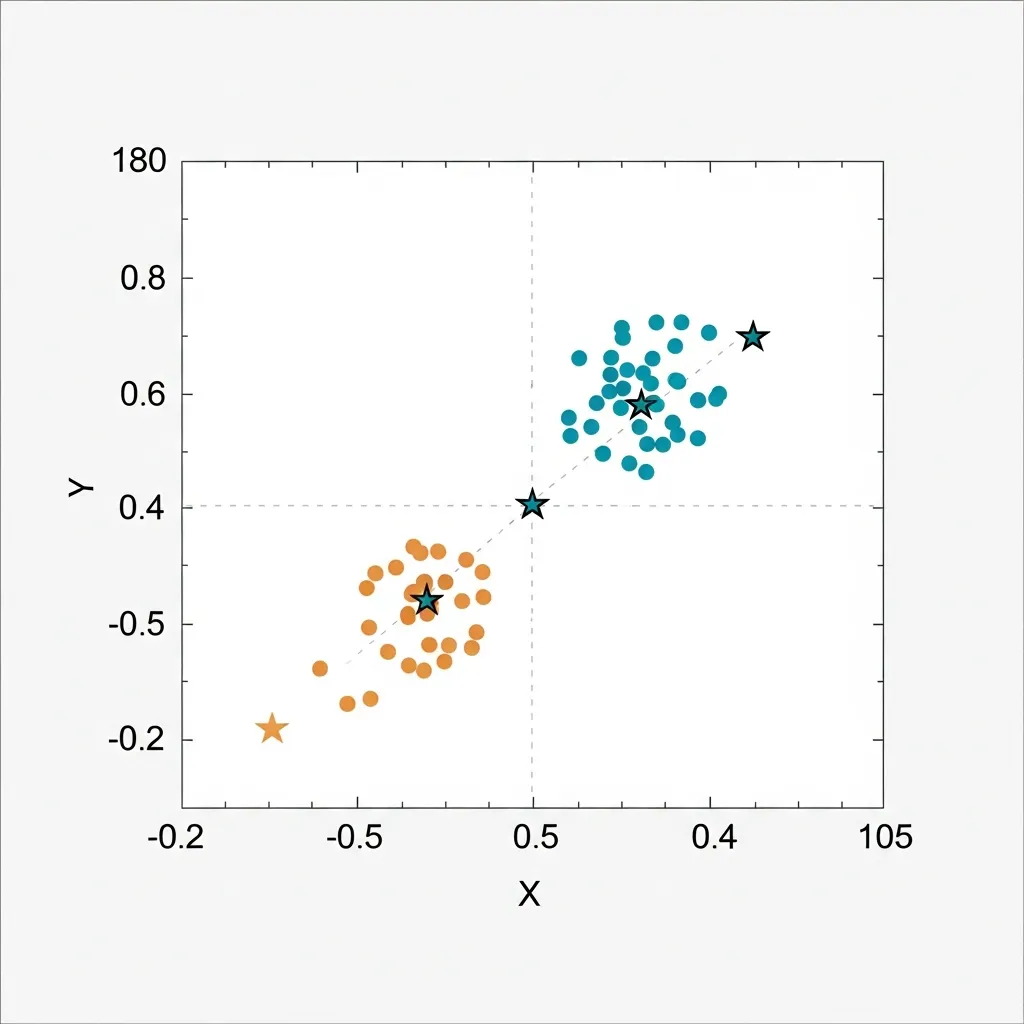
Beyond numerical scores, understanding the characteristics of each cluster is paramount. Cluster centroids (for algorithms like K-Means) represent the mean feature values of all data points within that cluster, effectively defining its "center" or typical profile. For density-based methods like DBSCAN, cluster density and the distribution of points within a defined region become the key interpretive elements.
To ensure statistical significance, data scientists must analyze whether the differences in feature values between cluster centroids are meaningful and not merely due to random variation. For example, in customer segmentation, if one cluster's average transaction value is only marginally higher than another's, it might not represent a truly distinct segment for targeted marketing.
Practical experience shows that examining the standard deviations or interquartile ranges of features within each cluster, and comparing them across clusters, helps ascertain their distinctiveness. A marketing professional might find a cluster significant if its centroid shows a unique combination of high-frequency purchases and a preference for premium products, clearly differentiating it from other segments.
Determining the Optimal Number of Clusters
A recurring challenge in cluster analysis is identifying the optimal number of clusters (K). While some algorithms (like DBSCAN) determine K intrinsically, many, like K-Means, require it as a parameter. Two widely used methods for this are:
- Elbow Method: This intuitive method involves plotting the sum of squared distances (inertia) of samples to their closest cluster center against the number of clusters (K). As K increases, inertia generally decreases. The "elbow" point on the plot, where the rate of decrease significantly slows down, is often chosen as the optimal K, as adding more clusters beyond this point provides diminishing returns in reducing within-cluster variance.
- Gap Statistic: A more statistically rigorous approach, the Gap Statistic compares the total within-cluster variation for different K values against that expected from a null reference distribution (e.g., random data). The optimal K is typically chosen where the gap between the observed within-cluster dispersion and the reference dispersion is maximized. This method offers a more objective criterion than the Elbow Method but is computationally more intensive.
The Cluster Validation Blueprint
To systematically evaluate success and ensure robust, actionable insights, consider the following protocol:
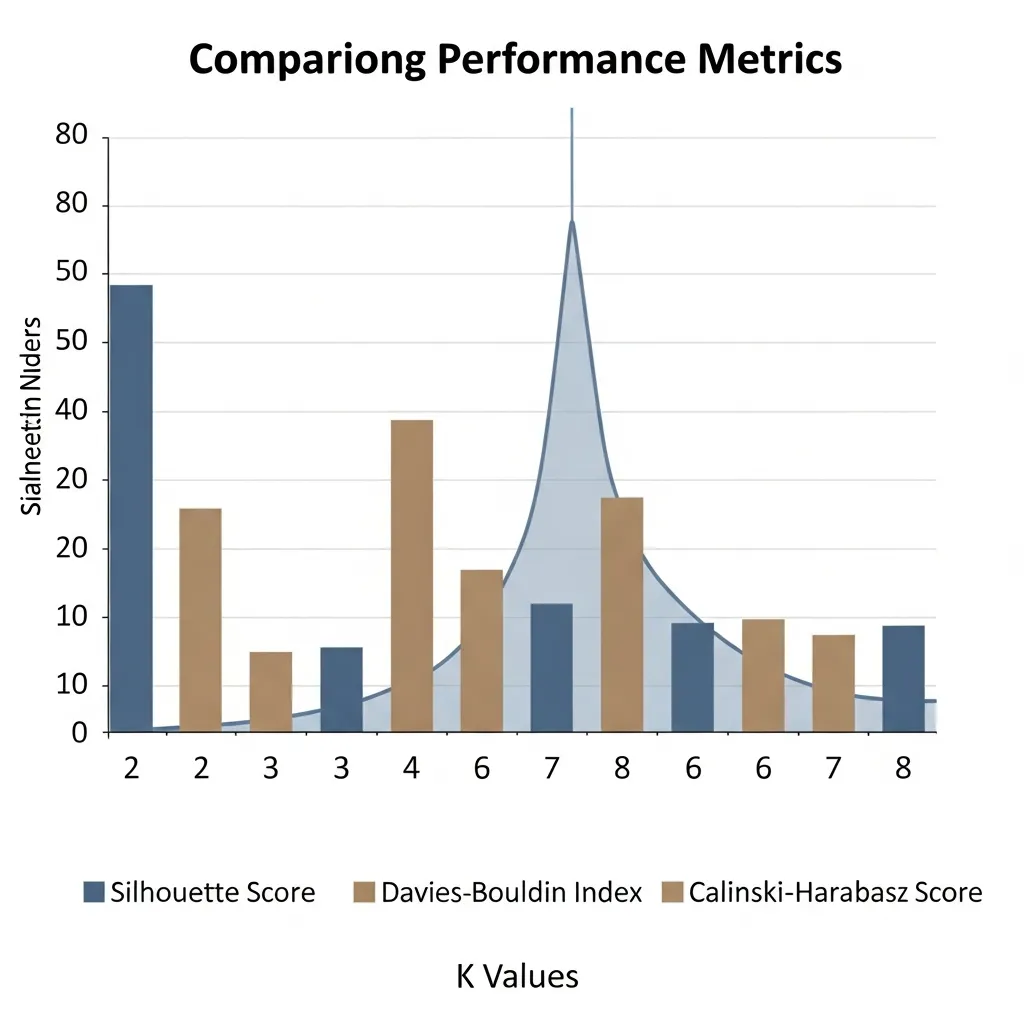
- Initial Internal Assessment: Begin by calculating the Silhouette Score, Davies-Bouldin Index, and Calinski-Harabasz Index for a range of K values.
- Optimal K Determination: Apply the Elbow Method and Gap Statistic to suggest an optimal number of clusters, triangulating insights from both.
- External Validation (If Ground Truth Exists): Use ARI and NMI to compare your chosen clustering against any available ground truth labels.
- Centroid and Density Interpretation: Analyze the mean/median feature values (centroids) and data point distributions within each cluster. Assess if these differences are statistically and practically significant.
- Qualitative Review: Complement quantitative metrics with domain expert review to ensure clusters are interpretable and align with business objectives.
Pro Tip: When evaluating clusters, never rely on a single metric. Different metrics highlight different aspects of cluster quality, such as compactness or separation. A holistic view, considering multiple scores alongside business context, leads to more robust and defensible clustering solutions.
Navigating Success Metrics Without Ground Truth Labels
Even without ground truth labels, evaluating cluster validity extends beyond internal metrics. Two powerful approaches are stability-based validation and geometric validation.
Stability methods assess the robustness of clusters by perturbing the dataset (e.g., resampling or adding noise) and re-clustering, then comparing the consistency of assignments. This reveals how reliable the discovered structures are. Geometric validation, conversely, focuses on the visual separation and distinctness of clusters in a lower-dimensional space.
Visualization tools like t-SNE and UMAP are indispensable here. They project high-dimensional data into 2D or 3D, allowing data scientists to visually inspect whether clusters are well-separated, dense, and truly meaningful. In my experience, these visual checks often uncover nuances that quantitative metrics alone might miss, providing critical qualitative insights into cluster quality.
Ultimately, the goal isn't always mathematical perfection. According to experts, meaningful clusters often trump mathematically perfect ones. A common mistake is over-optimizing for a single internal metric, which can lead to statistically robust but business-irrelevant segments. Through many projects, I've found that domain expertise is paramount. For instance, a cluster of "high-value, infrequent buyers" might score slightly lower on a Silhouette metric but be far more actionable for a targeted marketing campaign than a perfectly defined but ambiguous statistical grouping. The true measure of success lies in the practical utility and interpretability of the clusters for solving specific business problems.
Translating Cluster Insights into Actionable Business and SEO Strategy
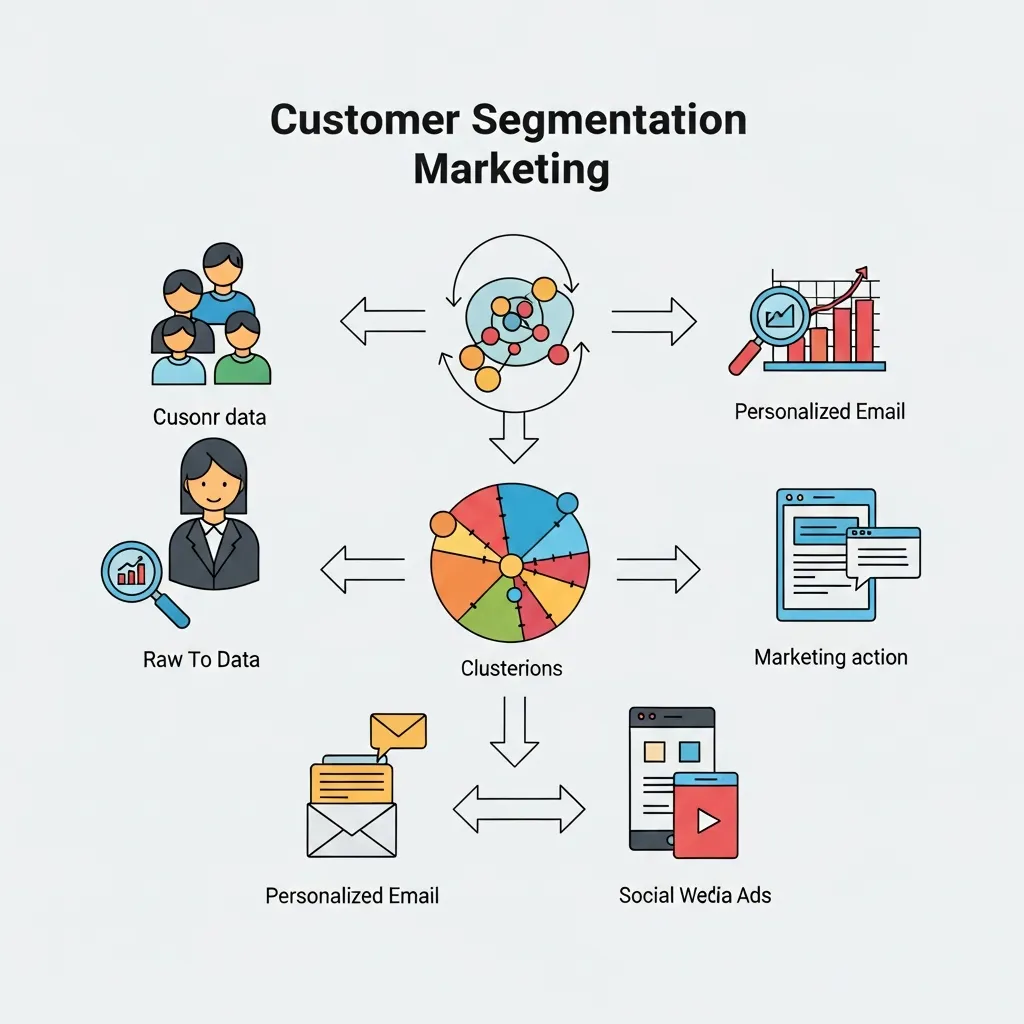
Clustering extends beyond data validation, forming the bedrock of dynamic business and SEO strategies. For customer segmentation, applying clustering to demographic, behavioral, and transactional data reveals distinct user groups. This empowers marketing professionals to craft highly targeted marketing campaigns with personalized messaging and product recommendations, significantly boosting engagement and conversion rates. For instance, an e-commerce platform might identify a "value-conscious buyer" cluster, tailoring offers to their specific needs.
In digital strategy, keyword clustering is indispensable. By grouping semantically related keywords, businesses accurately map user search intent, informing comprehensive topic clusters and content hubs. In my experience, neglecting to group related keywords often results in diluted authority and missed ranking opportunities. A well-executed strategy improves individual page rankings and strengthens overall site authority, driving more qualified organic traffic.
The effectiveness of these strategies isn't static. Continuous monitoring of live performance data—including conversion rates, traffic sources, and keyword visibility—is crucial. This feedback loop enables businesses to adapt topic clusters and refine marketing messages. A common mistake is treating clusters as immutable; instead, regularly analyzing user behavior and search trends allows for iterative refinement, ensuring strategies remain relevant and impactful.
Avoiding Common Pitfalls in Cluster Interpretation
Effective cluster interpretation demands vigilance against several pitfalls. A significant danger lies in over-interpreting clusters formed from mere random noise; algorithms will always find groupings, even where none genuinely exist in the underlying data.
In my experience, a common mistake is celebrating a high silhouette score without critically evaluating if the resulting segments hold true business value or are merely statistically distinct. For instance, customer clusters might be perfectly separated but offer no actionable differentiation for marketing campaigns.
Furthermore, clustering algorithms are highly sensitive to outliers, which can drastically distort cluster centers and boundaries. Poor initialization, especially in methods like K-Means, can also lead to suboptimal or inconsistent results. In my view, robust domain expertise and iterative validation are paramount to discerning meaningful insights from statistical artifacts.
Establishing a Robust Framework for Ongoing Cluster Success
Establishing a robust framework for measuring cluster success necessitates an iterative evaluation process, not a one-time validation. Models require continuous refinement and re-validation against evolving business objectives.
In my experience, relying solely on technical metrics like silhouette scores often misses crucial practical utility. I believe the true measure of success is the sustained, actionable insights derived. When applying this, ensure you balance statistical rigor with tangible business impact.
Start now by implementing a quarterly review cycle for your existing cluster models, focusing on their real-world application.
Frequently Asked Questions
What are the best metrics for measuring cluster success?
Common metrics include the Silhouette Score, Davies-Bouldin Index, and Calinski-Harabasz Index for internal validation, and ARI or NMI for external validation.
Why is measuring cluster success important in SEO?
It ensures that keyword clusters are semantically related and logically grouped, which helps build topical authority and improves search rankings.
How do you measure cluster success without ground truth labels?
You can use internal validation metrics like the Silhouette Score or stability-based methods that test how consistent clusters remain when the data is perturbed.
What is the "Elbow Method" in cluster analysis?
It is a technique used to determine the optimal number of clusters by plotting the sum of squared distances and finding the point where the rate of decrease slows significantly.